|
The Charting Module
for Visual Rental Pro
Produce beautiful charts of your Visual Rental
Pro data in a variety of different chart types. Graphically
depict rental revenue, commissions, processing fees, taxes,
insurance costs, occupancy statistics, user & agent activity, etc...
over a user-selected timeframe. Produce pie and donut charts, bar
charts, line charts, and area charts.
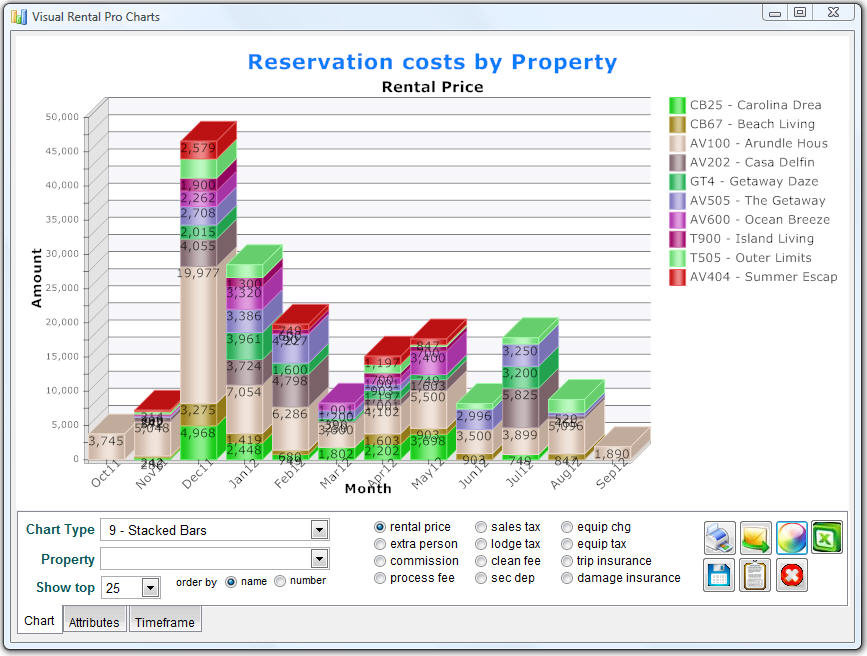
Produce charts showing reservation pricing (rental price, extra
person fee, processing fees, cleaning fees, taxes, equipment costs,
security deposit amounts, and insurance amounts) in a 12,
18, or 24 month time window. View
financial information on a daily, weekly, monthly, quarterly, half
years, and yearly basis.
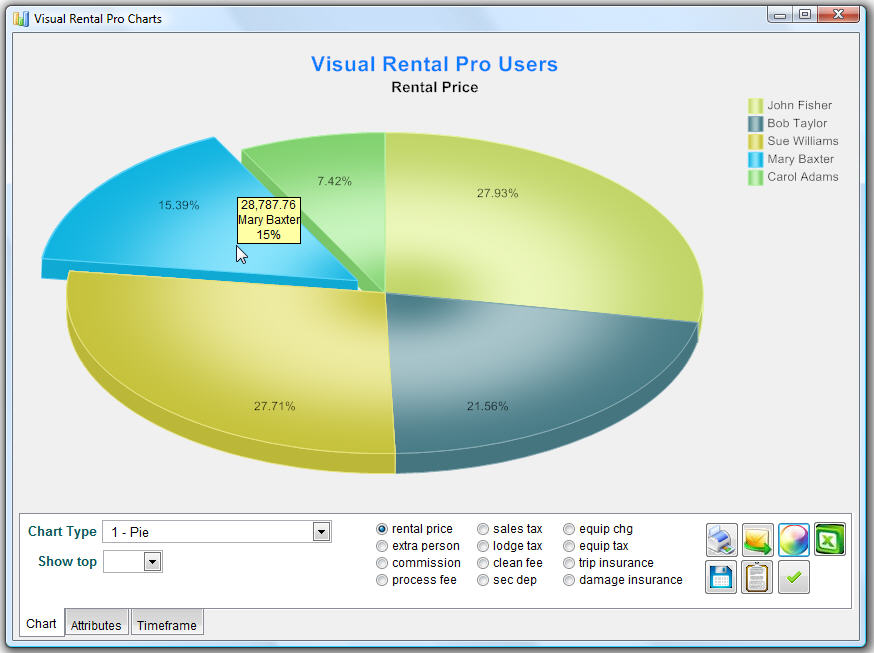
Produce pie and donut charts showing summary amounts for selected
timeframes.
Change chart types dynamically with a click of the mouse.
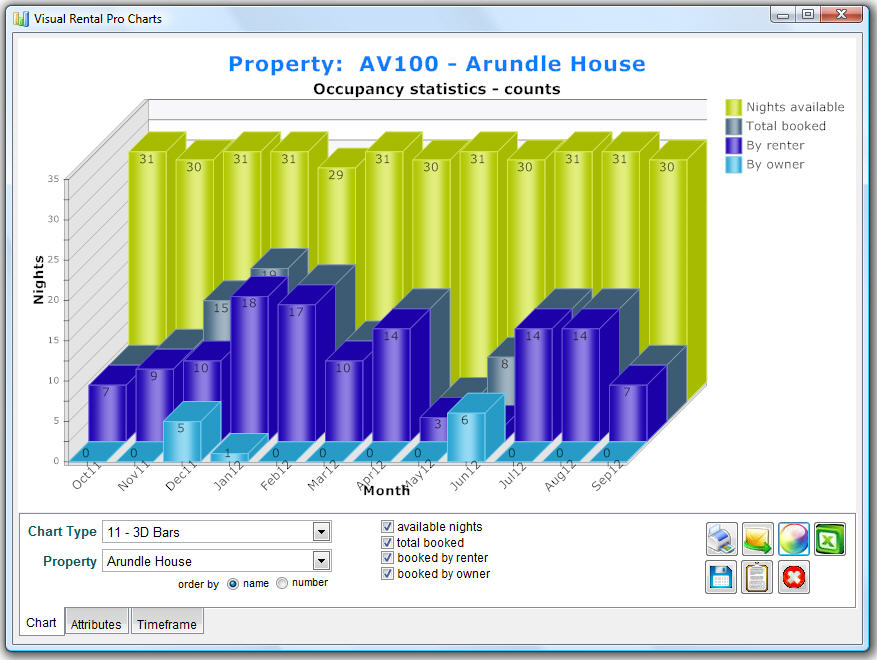
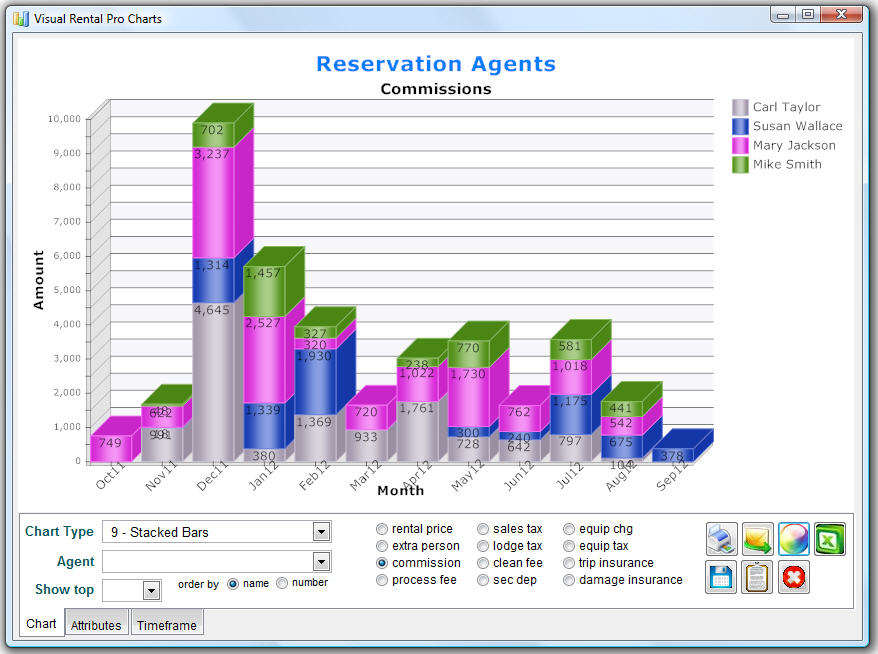
Produce occupancy statistics charts. Produce charts by agents,
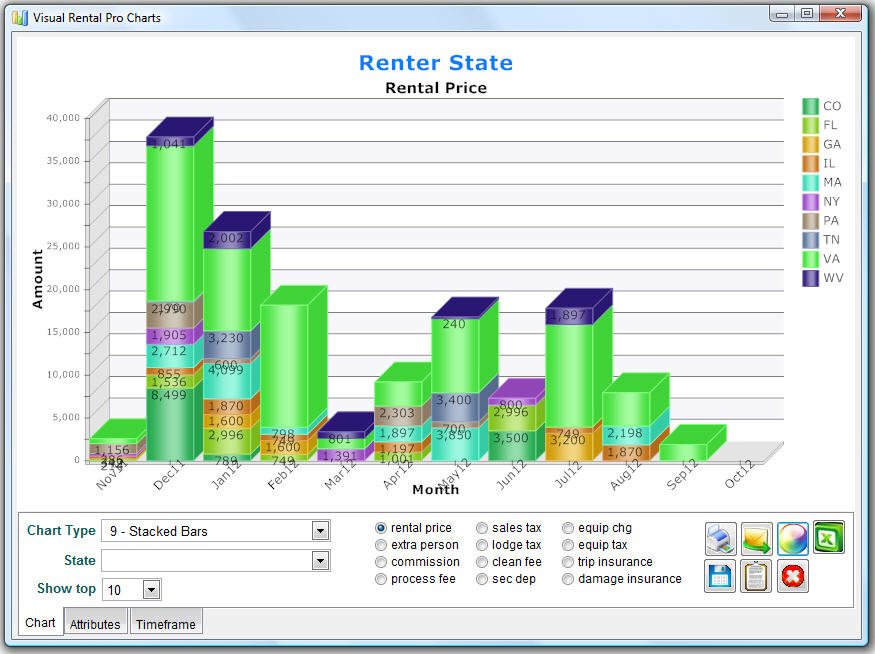
vendors, and users. Produce charts by renter information (by renter
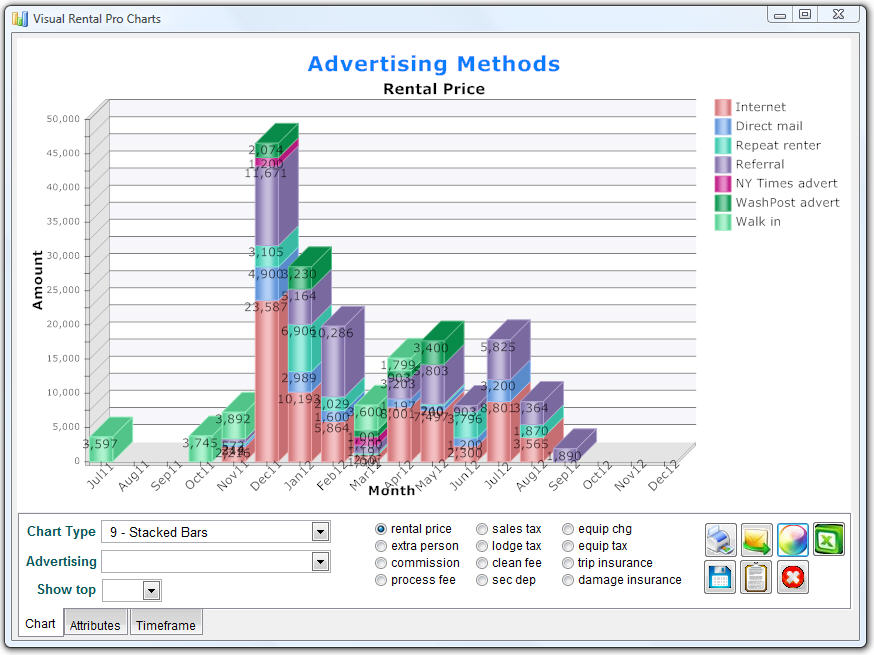
city, state, zipcode, and country). Generate charts showing rental
pricing and commissions by advertising method. Identify where the
majority of your renters come from and what advertising methods work
best.
Data filters & reporting options include the ability to specify a
from and until time window to report on, and the ability to
include/exclude hidden properties and owner reservations. The user
can also include/exclude properties flagged as "longterm" rental
units.
Each chart can be saved to a file, printed, emailed, or copied to
the Windows Clipboard.
To purchase the
Charting Module for Visual Rental Pro, please click
here.
The following are a few sample charts produced
with the Charting Module for Visual Rental Pro. Click on each image
to view a full size version.
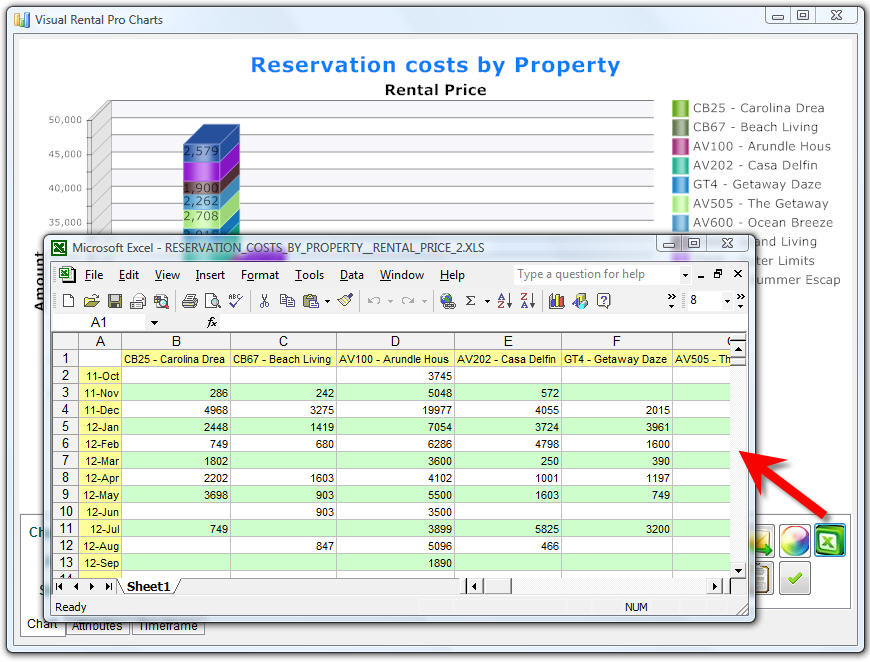
| Rental price by month - all
properties |
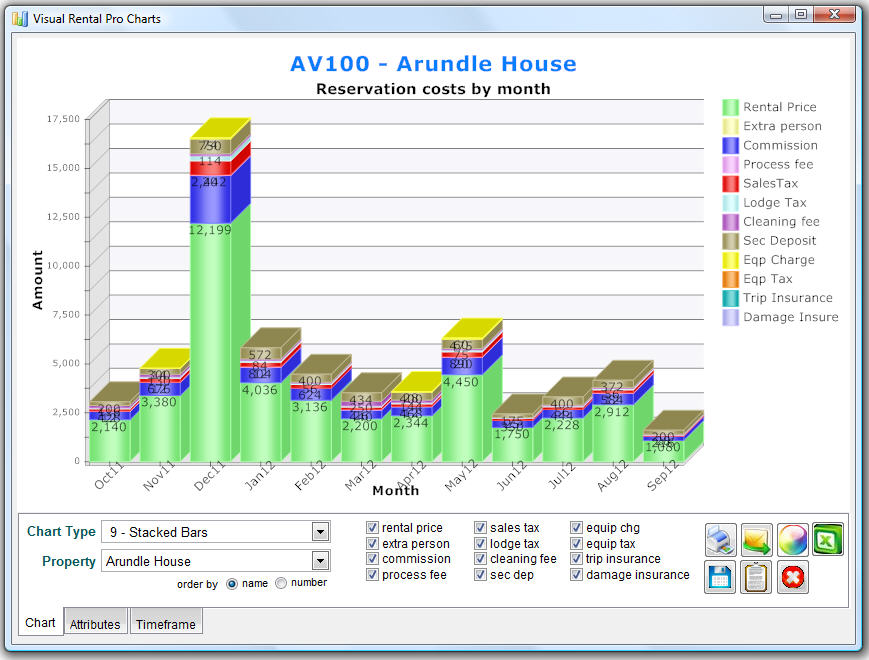
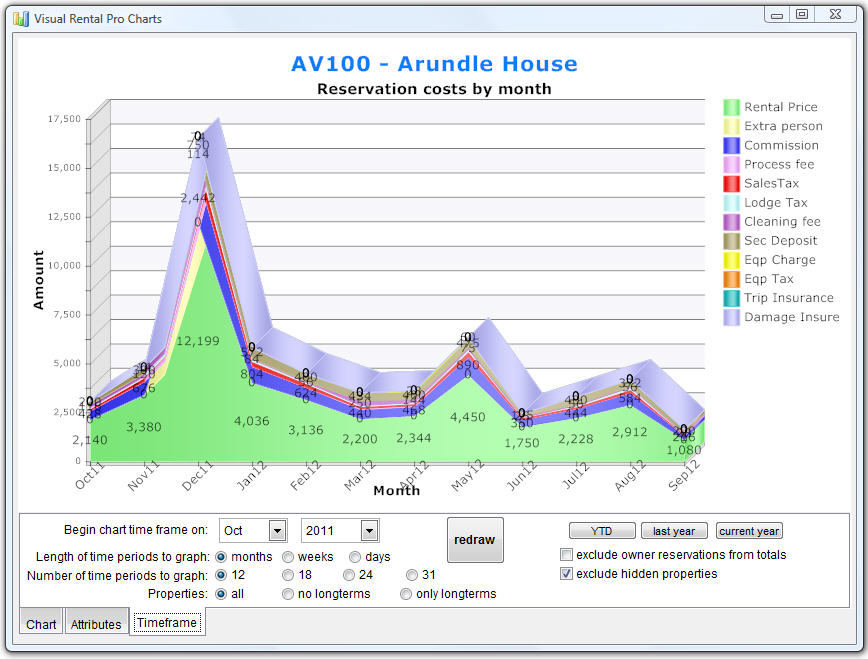
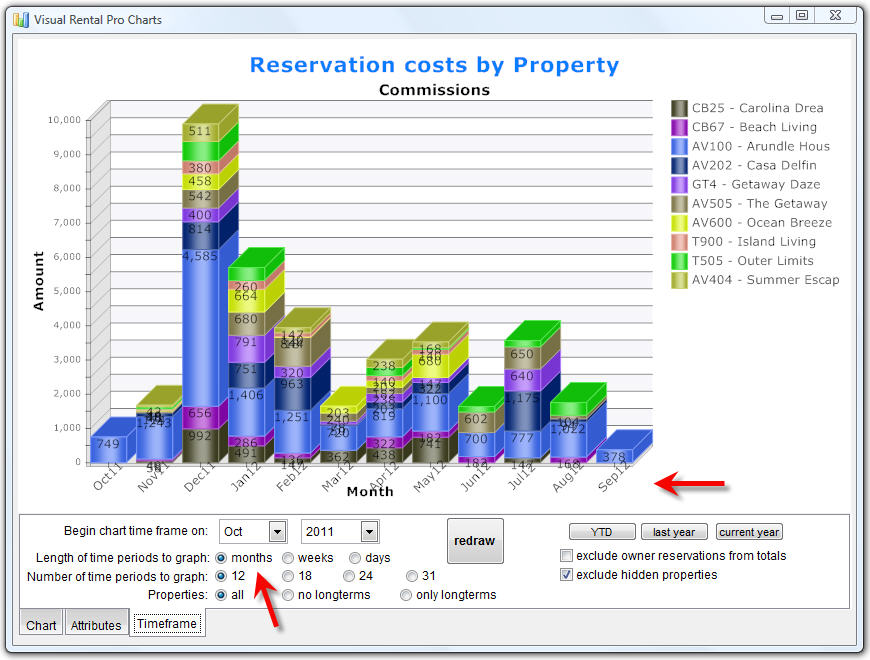
Reservation costs by month - selected
property |
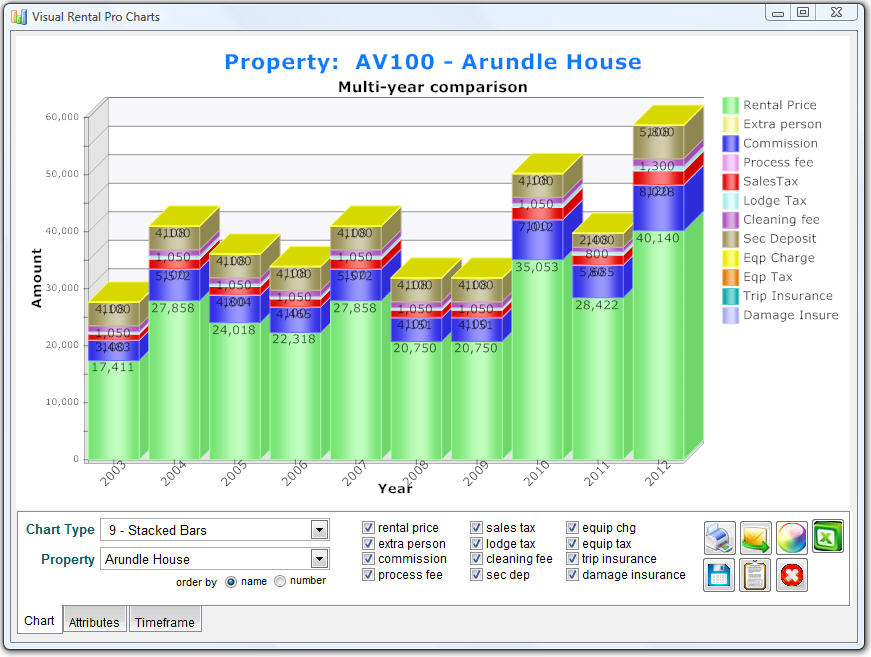
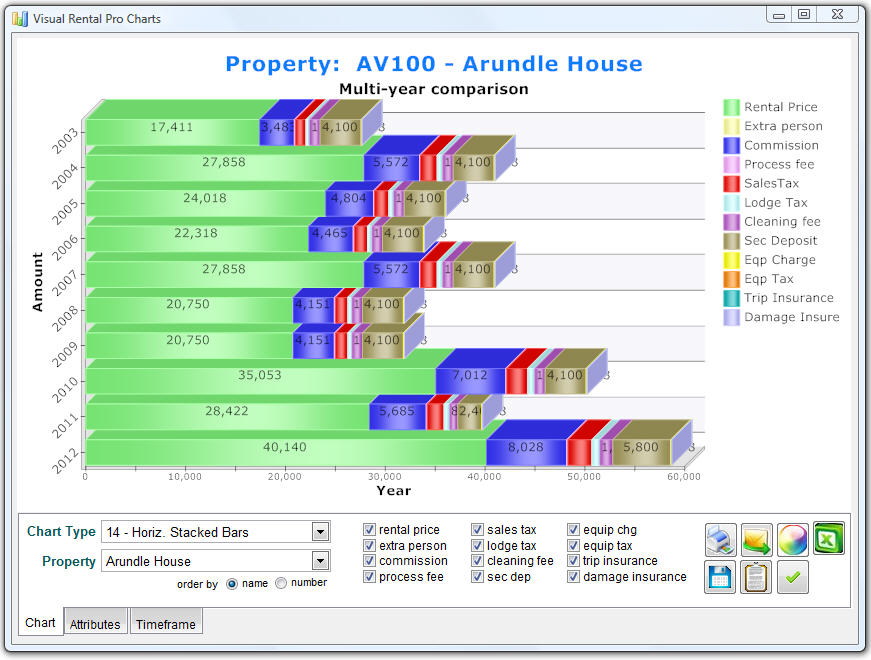
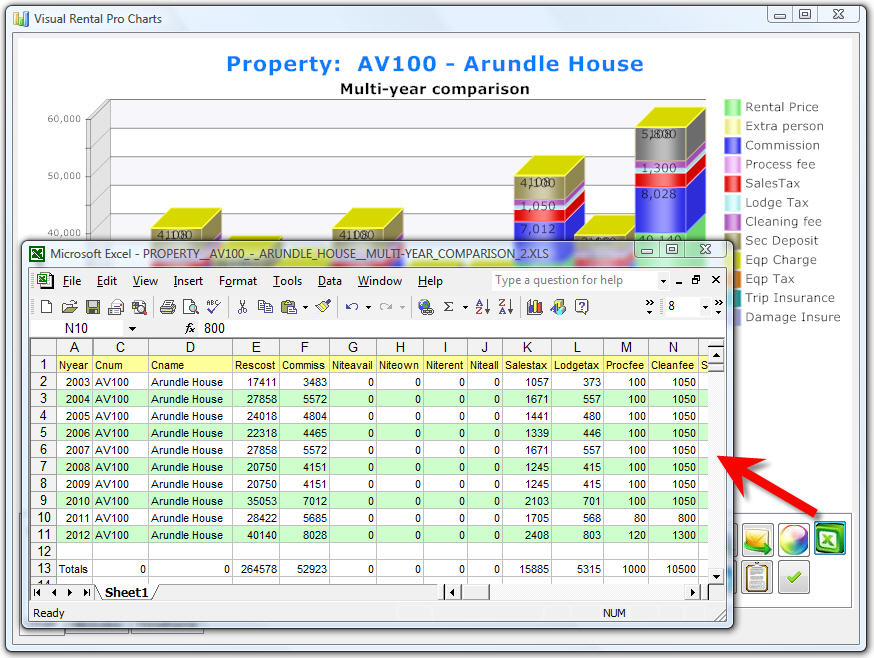
Multi-year comparison |
 |
 |
 |
| Occupancy
statistics |
Agent and User reporting |
Charts by renter city, state, zip, & country |
 |
 |
 |
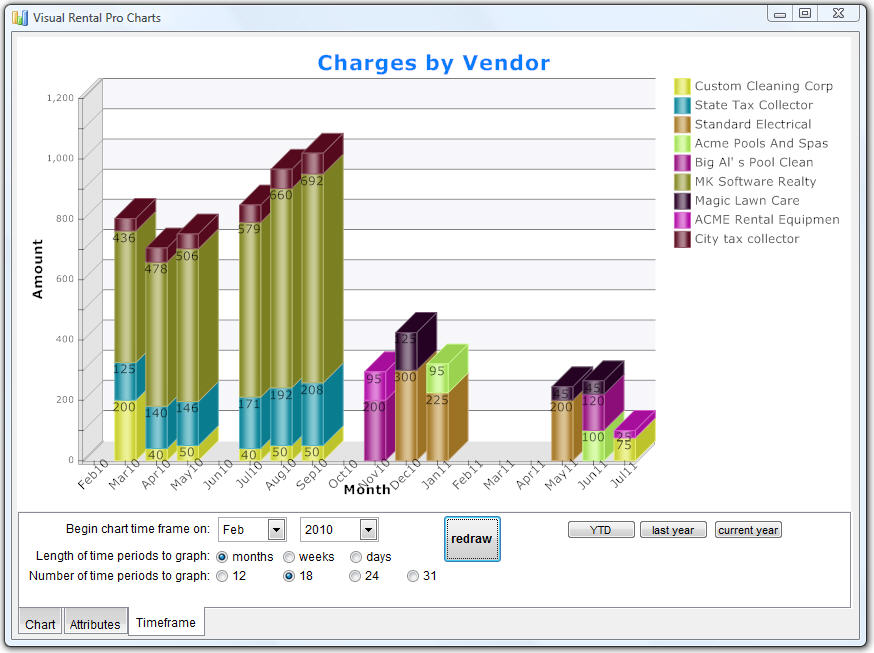
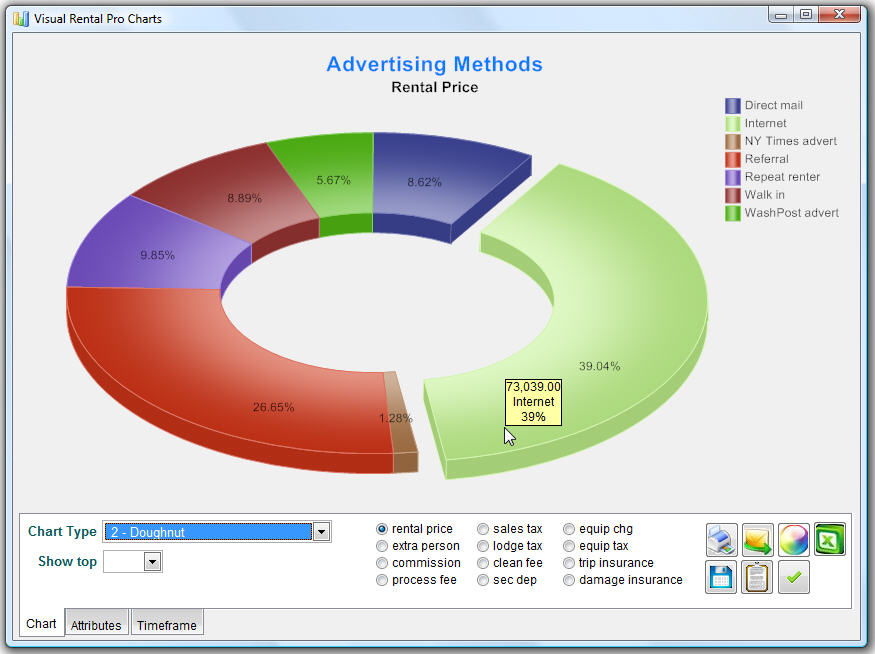
| Advertising
methods |
Vendor charges |
Summary total piecharts by users & agents |
 |
 |
 |
| Summary total
donut charts |
Area diagrams |
Reservation costs by horizonal bars |
 |
 |
 |
| Export directly
to formatted Excel files |
Excel formats match chart output |
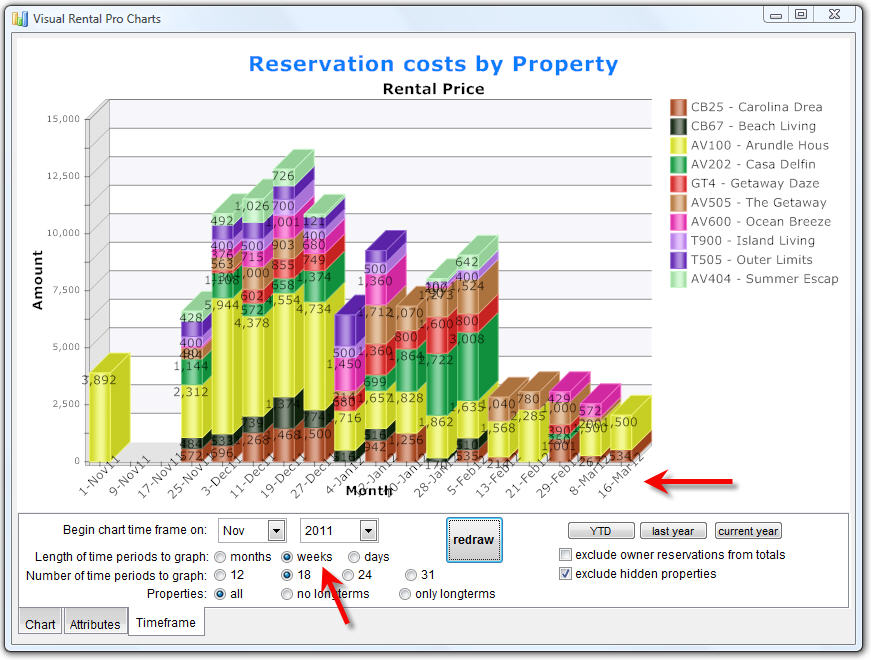
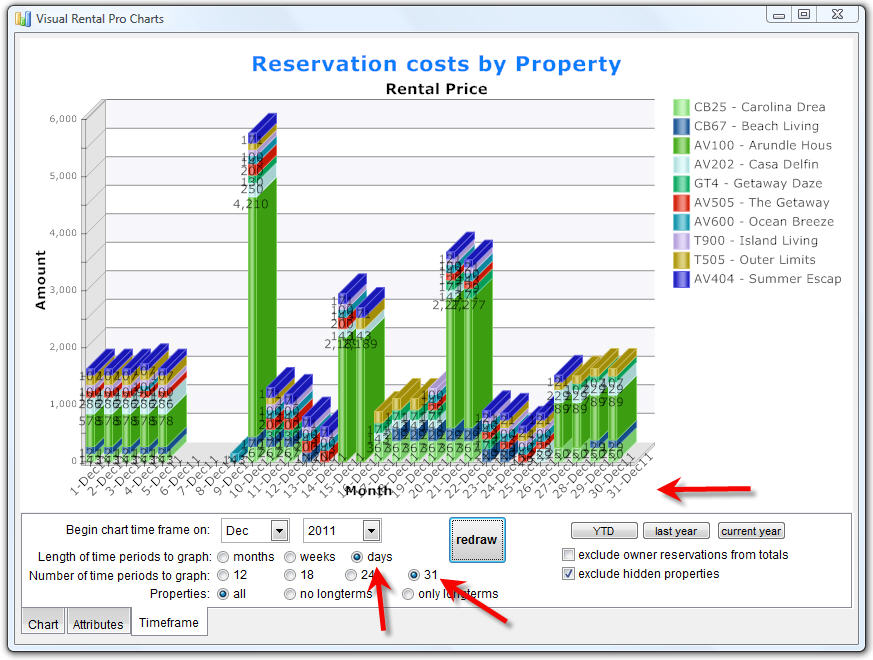
Chart data by months, weeks, or days |
 |
 |
 |
|
Chart data by months, weeks, or days |
Chart data by months, weeks, or days |
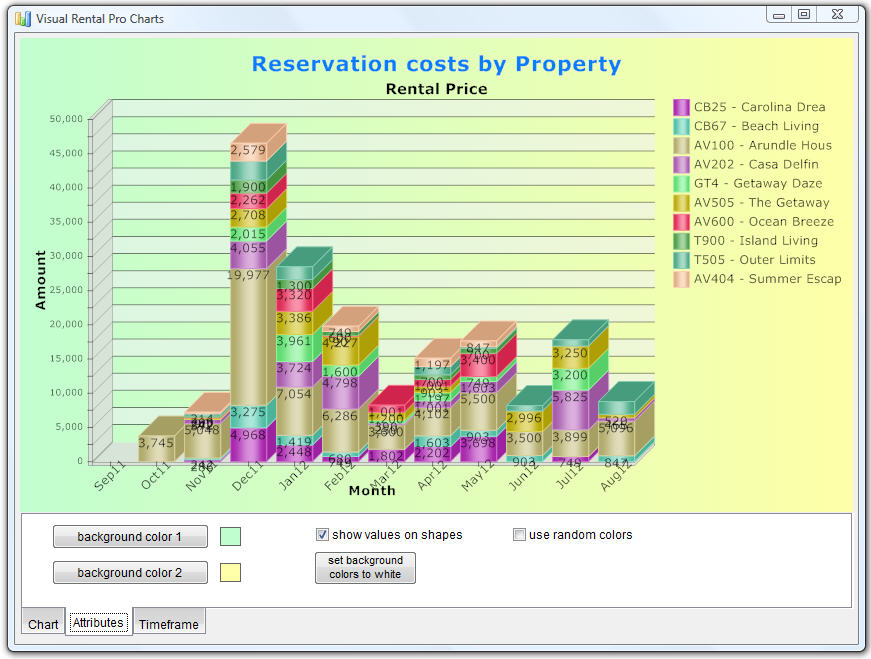
Assign background colors to charts |
 |
 |
 |
Click the image below to watch a short video
of the Charting Module for Visual Rental Pro in action.

To purchase the
Charting Module for Visual Rental Pro, please click
here.
|
|